Page Load Performance (Synthetic Monitoring)
The Silverhawk Synthetic Monitoring feature provides real-time performance insights by simulating user sessions using headless Chrome. It measures metrics like LCP, FID, CLS, TTI, and Speed Index to help you identify bottlenecks and improve your app’s performance.
How It Works
- Launches a headless browser session for your provided URL.
- Captures key metrics using Google Lighthouse APIs.
- Generates performance scores and visual timelines.
- Displays detailed results in the Silverhawk dashboard.
Setup Instructions
Step 1: Create a New Test
- Navigate to Dashboard → Synthetic Monitoring → Page Load Performance.
- Provide your target URL (e.g. https://example.com).
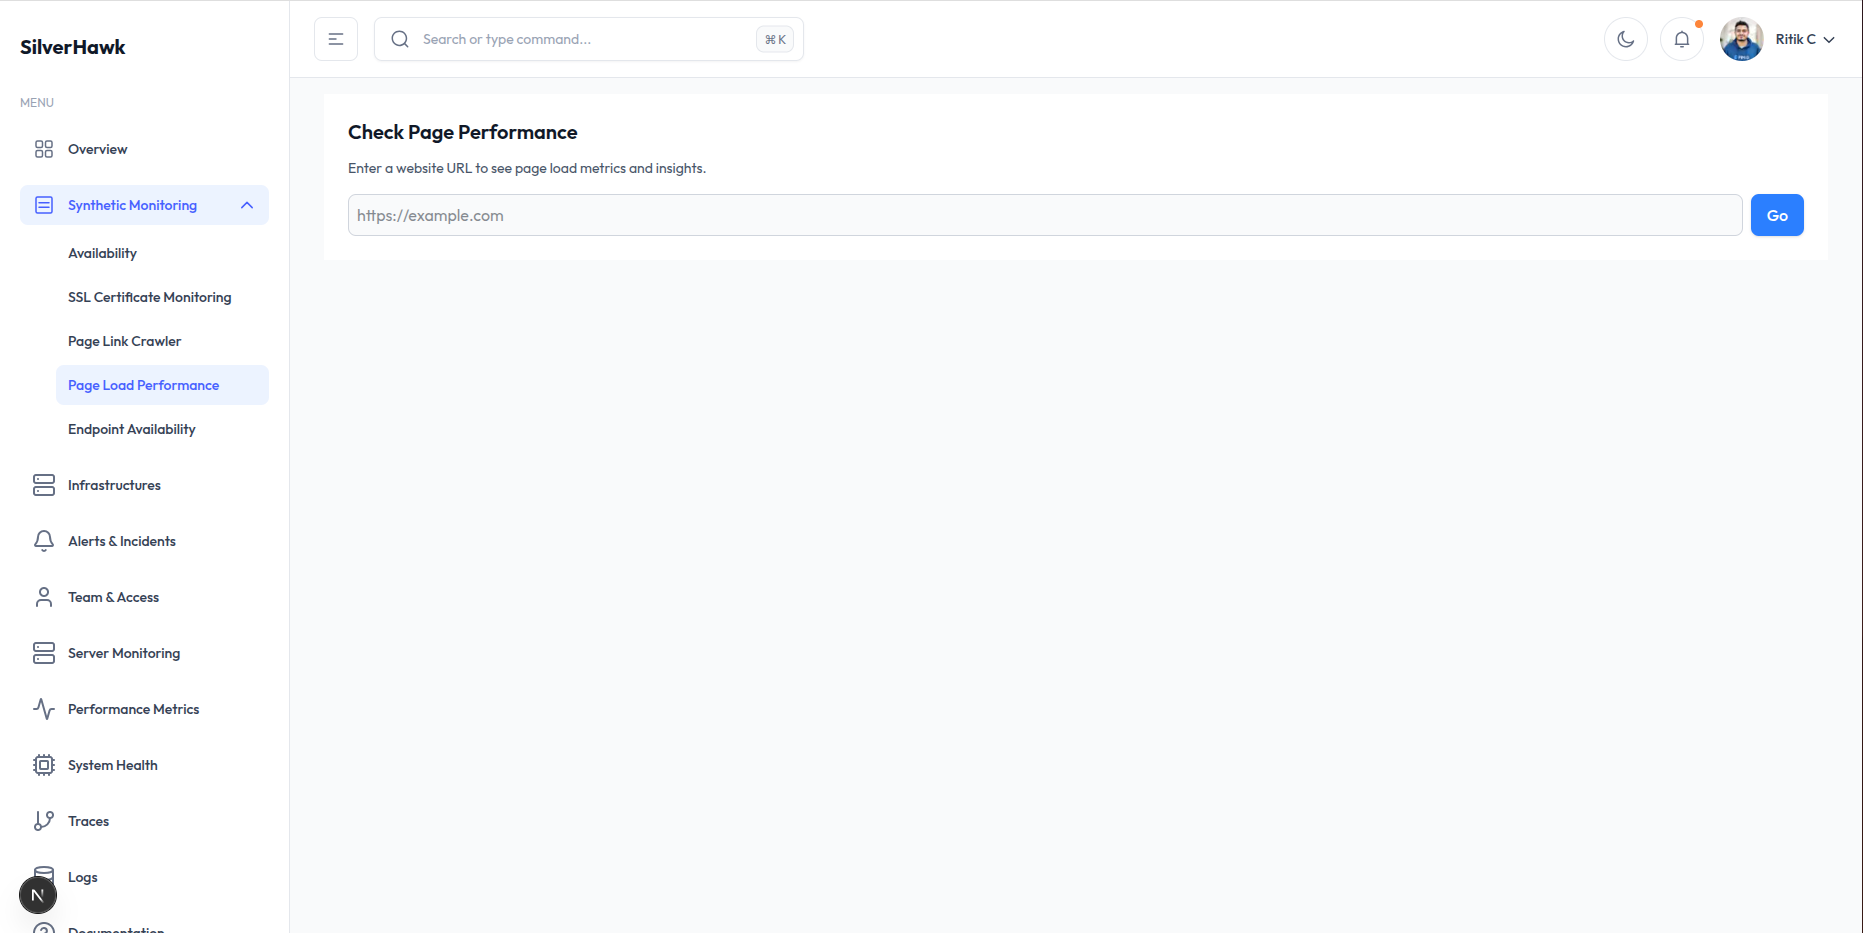
Step 2: Trigger the Test
Silverhawk will simulate a real browser visit, collect performance data, and display it on the dashboard under Page Load Performance.
Dashboard Insights
- Header Information: Displays tested URL, fetch time, and test mode.
- Screenshot Timeline: Visual progression of page load from blank to fully rendered.
- Performance Metrics: Detailed scores for FCP, LCP, TTI, CLS, and TBT.
Example Metrics
- FCP (First Contentful Paint): Time until first visible content appears.
- LCP (Largest Contentful Paint): Time to render main content.
- TBT (Total Blocking Time): Measures JS blocking time.
- CLS (Cumulative Layout Shift): Measures visual stability.
Interpreting Results
| Score Range | Color | Action |
|---|---|---|
| 90–100 | 🟢 Green | Excellent performance |
| 50–89 | 🟠 Yellow | Needs improvement |
| 0–49 | 🔴 Red | Critical issues found |
Troubleshooting
- No screenshots? Ensure Chrome headless dependencies are installed.
- Score = 0? The page may be blocked or unreachable.
- High CLS? Fix layout shifts with fixed-size images.
Best Practices
- Run tests regularly across multiple regions.
- Compare desktop and mobile performance separately.
- Enable alerts for score degradation.
- Combine synthetic monitoring with real user data (RUM).
Summary
- Simulates real browser page loads using Lighthouse.
- Captures render timeline and key metrics.
- Integrates with CI/CD and API endpoints.
- Provides full performance visibility in one dashboard.
💬 Need Help?
- Visit silverhawk.ritikprojects.dev/docs
- Join our community Discord → #infra-support
- Contact: silverhawkapm@gmail.com